Measured in reflection of Waku Protocol’s stress tests
Introduction
Any garbage collector algorithm harms performance. I try to show in this article that how the currently used Nim refc algorithm influences the reachable throughput of Waku protocols and what drawback we need to mitigate in order to enhance it. These are translate-able to scalability metrics.
Context
- Waku offers different configurations where a full node provides overlapping services seemingly parallel for client-nodes.
- Meanwhile the node participates in the gossipsub relay network it processes almost every message to be able to provide services like filter/store and lightpush.
- These services are concurrent to each other in term of processing.
- Waku uses the refc GC algorithm
- Waku is single-threaded with utilizing chronos’ async programming scheme.
- This has a great effect on memory use due to copy of Future context when using async functions.
- Our measurements done with various stress testing conditions and configurations in order to simulate different real-world scenarios.
Observations
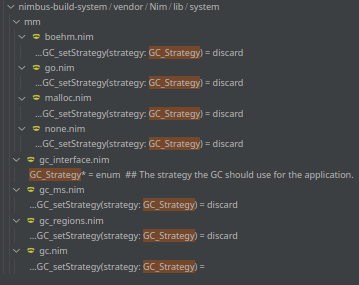
- Nim GC has certain thresholds when it intervenes and starts cleanup.
- Unfortunately, the supposed algorithm tweaks seem not implemented for refc.
- Nim GC pre-allocates memory from the global heap opportunistically.
- Pre-allocation of memory happens even before real need appears (actual objects need to be allocated).
- It can simply crash the application if it hits physical memory boundaries - this happens even if clean up is possible and GC heap is not full.
- Nim GC never releases pre-allocated memory from its heap.
- This causes problems running in memory-restricted environments (which is likely to happen when operating waku-node in a virtualized environment).
What we measured
- Processing rate of request - mostly lightpush protocol’s throughput.
- Memory allocations and cleanups
- Major contributors of heap allocations
Measurements
Two types of stress conditions we set up.
- Message push frequency and variations of payload sizes
- Runtime environment - CPU and RAM limits of docker container.
Test setup
We use various tools in combination, first, in order to simulate a close to real-world working condition, second, to achieve specific stress conditions on the measured waku-node.
In our setup, we use waku-simulator that sets up a mini waku network and the measured waku-service-node that supports measuring non-relay protocols of Waku.
On the other side of the test we utilize our lite-protocol-tester application that is capable to test waku network and service nodes in a configurable fashion.
In our tests, we expect n number of publisher clients to push messages via the service node in a configured size and frequency, and m number of receiver clients that subscribe to these messages on the same service node to add load on the filter service.
We simulate a small network with 8 relay nodes, and RLN is not enabled in these measurements.
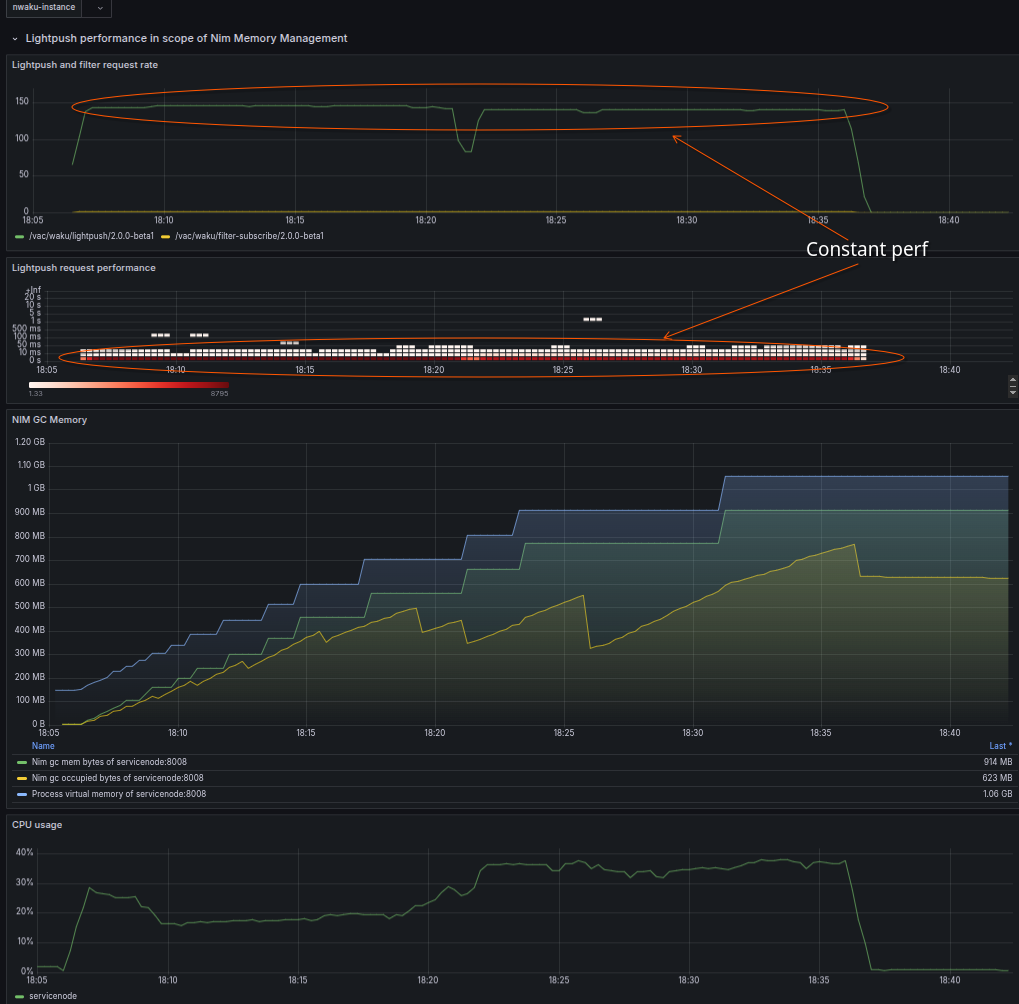
Case 1 - Baseline test
For the first case I try to show the easy case where performance is steady and everything is under control. For this I used 100 msg/sec frequency and relatively high RAM for the process, 8GB.
There are four phases of test each lasts 10min with growing payload sizes:
- 0.5k-1k
- 2k-10k
- 50k-90k
- 130k-149k
-
Request processing plateaus show that waku-node within the given conditions has a constant processing rate. It can keep up with expected message rate in the first two section (payloads less the 10k) but performance degrades with larger payloads even to only 40% of the expected.
- In the second panel from the top we can see how response times of lightpush protocol are growing and combine with high CPU load.
-
Memory occupation shows clearly the pessimistic allocation of heap by the memory manager.
-
Even after the test finished actual memory usage keeps high.
-
Memory once allocated will never be released…
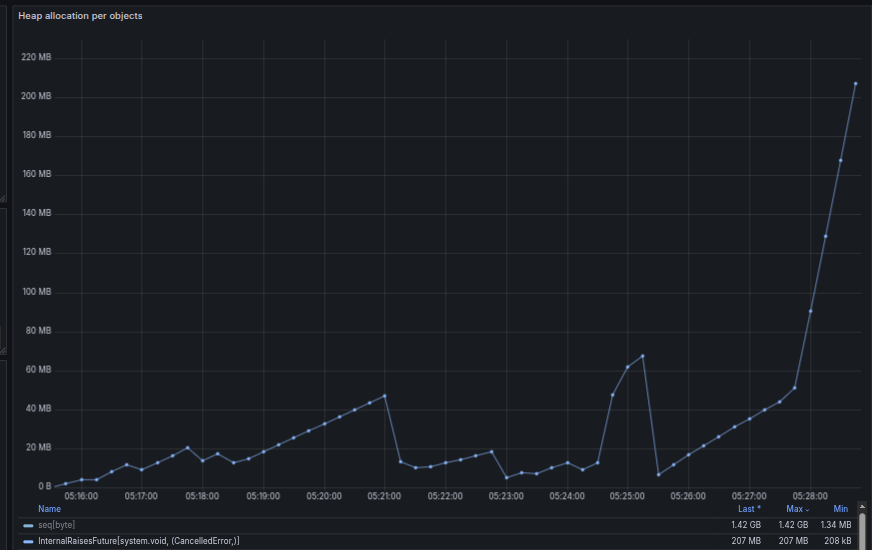
The main contributors to the memory use shown in the following graph
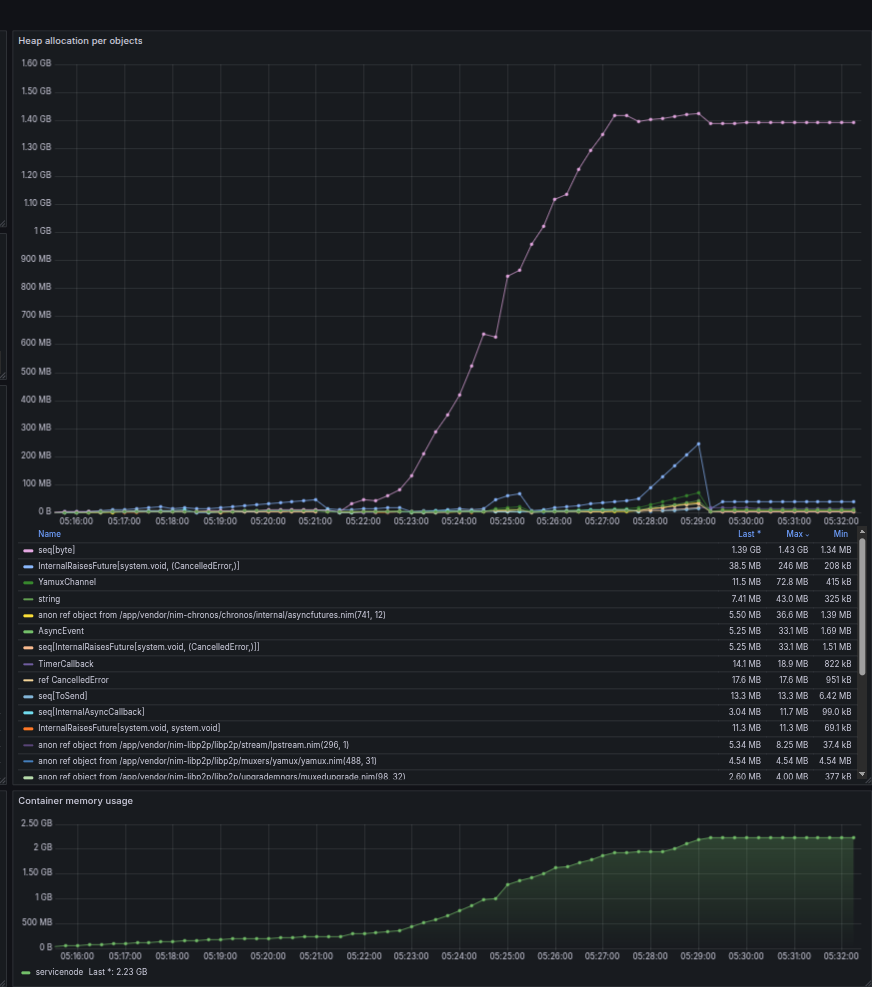
- In this test, where we used relatively low request rate, it shows how important when using async technique with chronos that the context of the async procedure can have high impact on memory allocations and needs - due the Future context will hold a copy of every argument and captured context!
- With larger payload is used for the test seq[byte] allocation takes the majority of the allocations.
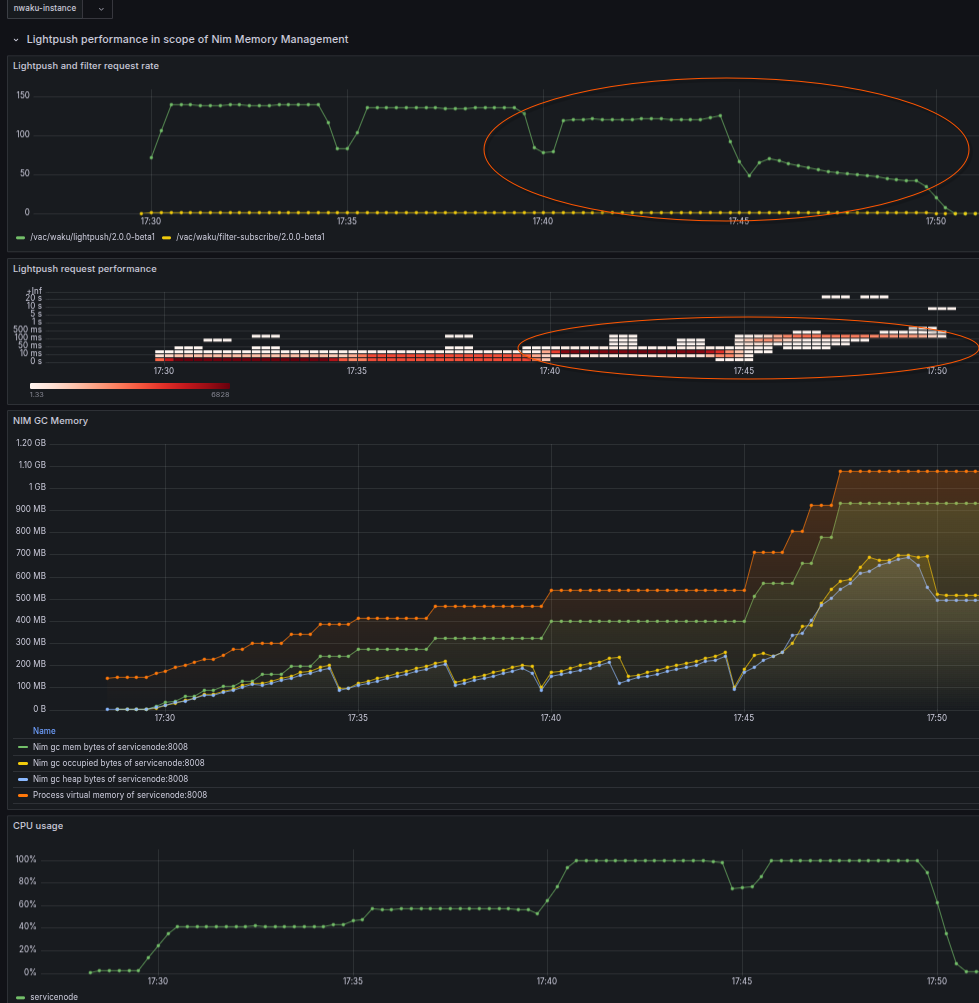
Case 2 - Showcase of memory overallocation cause crash
In this case we simulate high frequency of message push requests (150/sec) with growing number size of payload, but service node available RAM is limited to 2GB by docker.
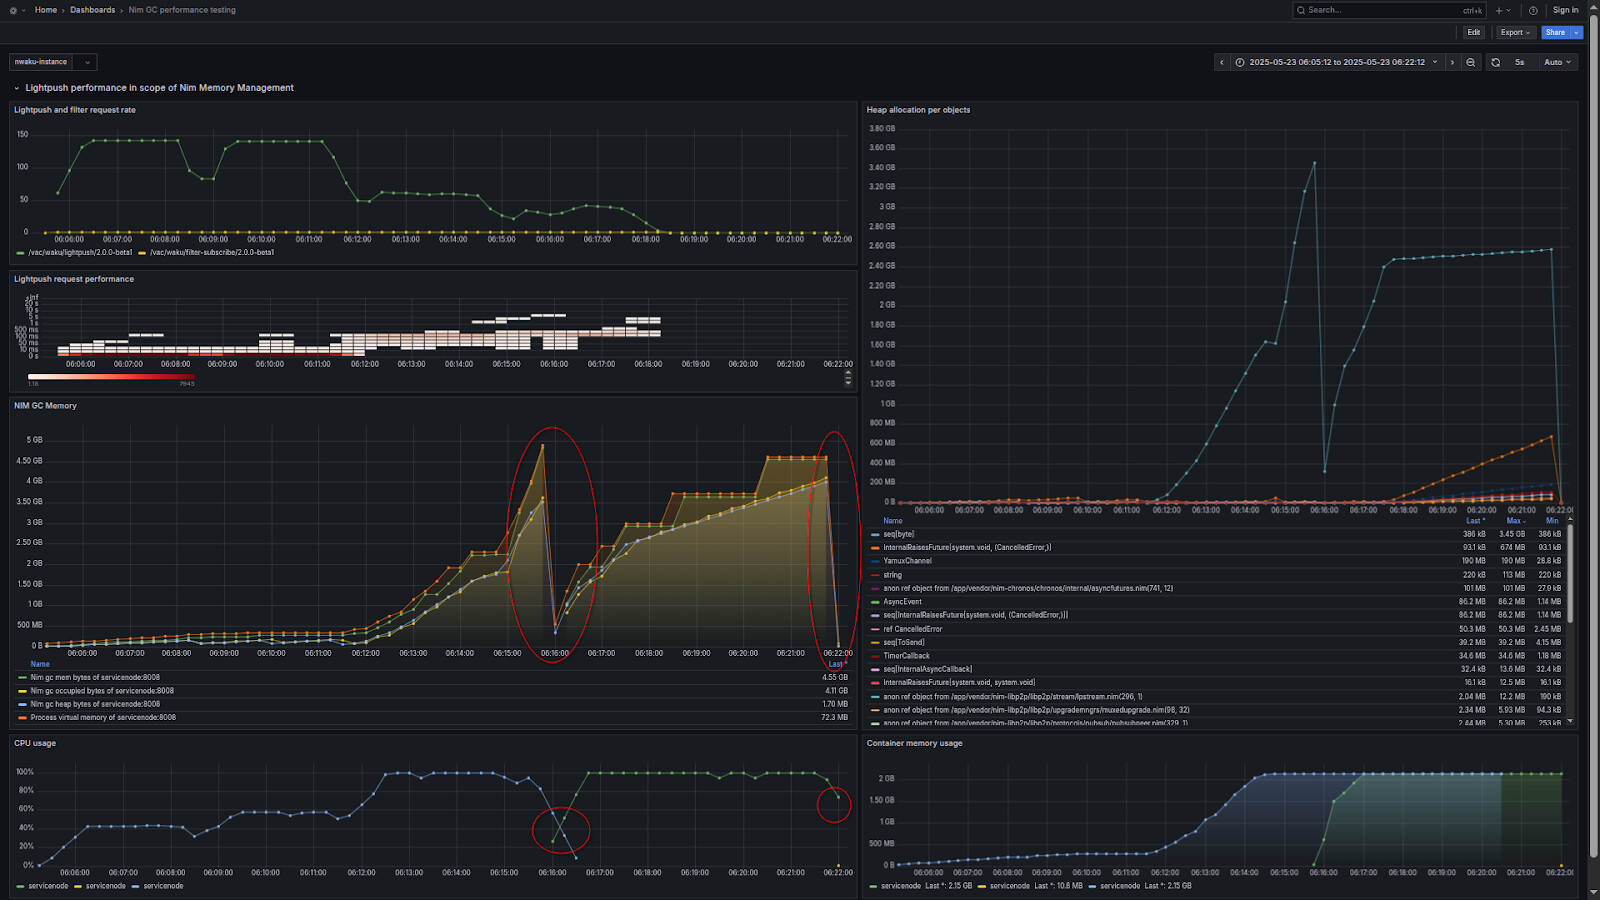
Although measurement seems not very accurate - or data collection has some issues and Memory graph shows double the memory available - as swapping was allowed by docker - it clearly shows the service node process and container crashed and restarted due to over allocating memory.
From previous measurement we can see that Nim memory manager pre-allocates memory from global heap even before trying to clean-up dangling objects. This process needs to be revised and optimized if possible to enhance runtime performance in restricted environment.
This stress test verifies satisfactory performance with small payload messages - see plateaus of 150 msg rates in the first two phase, but highly low performance when payloads are bigger than 50k.
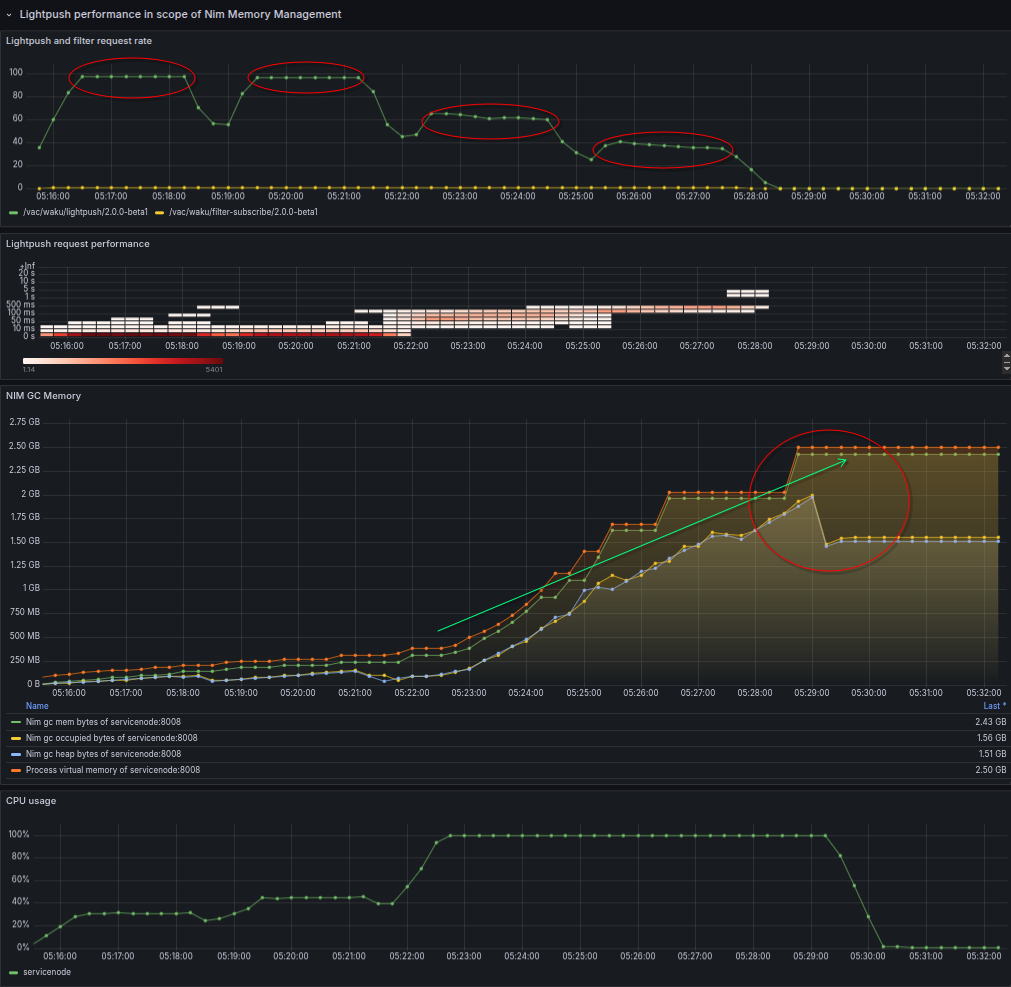
Case 3 - Nim memory management and GC fingerprint on performance
To be able to see performance effect of GC I applied a 1h long stress test using only small payloads but trying to hit high request frequency - 250 msg/sec.
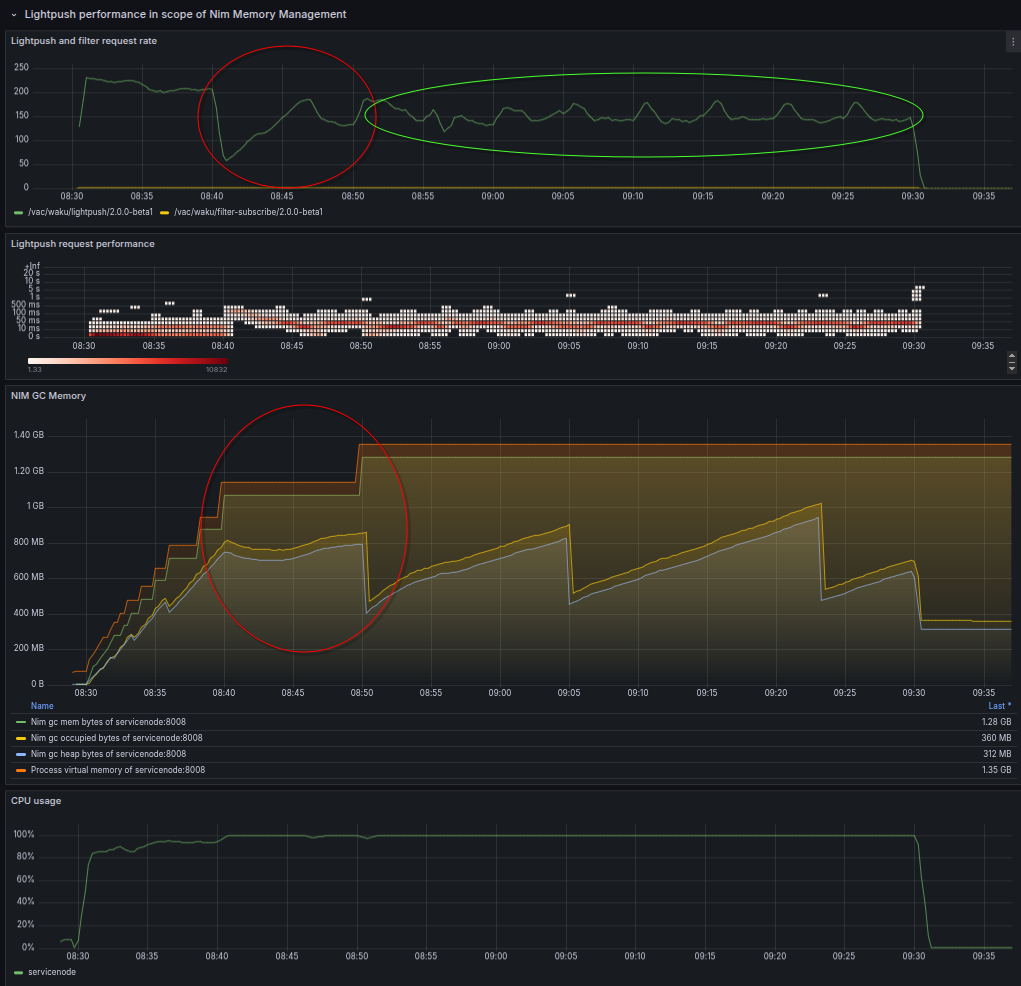
- It seems as long as a certain threshold is not reached - in the first 10 min of the test - the performance is reasonable ok and close to the desired 250 msg/sec.
- But as soon as GC hits more frequent management on allocated objects the performance starts to degrade and finally stabilizing around processing 150 msg/sec.
Using relatively small message payloads highlights the memory stress of using heavy async operations with chronos library.
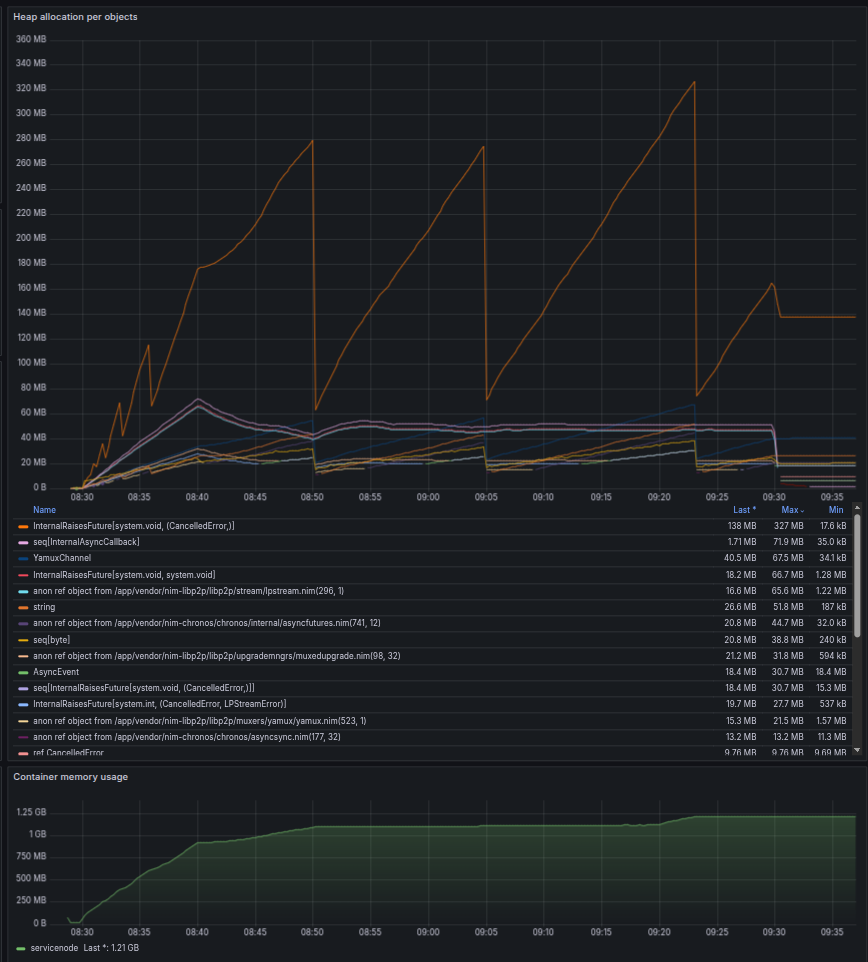
Heaptrack analysis
Findings
- Major contributors to memory allocation (payload represented by seq[byte]) are during gossipsub.publish.
- Exactly pubsubpeer.sendMsgSlow and lpstream.writeLp / yamux.write.
- These give 80-85% of the memory allocations.
- Handling small messages is less exposed to unnecessary copies, memory peaks happen slower or not at all.
- Normal relaying - without publish - is free from the above pattern.
- A test with the relay switched off or with no relay peers for the service node verified that no such memory consumption occurred during publishing new messages, which was an expected outcome.
- Handling filter’s push to peers has some influence on performance, but not significant in memory consumption.
- Currently used miniprotobuf implementation uses many temporary allocations for decoding messages.
- onSend observers - which is used non invasive way in nwaku - causes slow path to be used and adds unnecessary copies during broadcasting messages.
Example measurements.
Ran several configurations with heaptrack that follow memory allocations with a slightly modified Nim version.
Most of the stress tests done in a simulated docker compose environment that involves waku-simulator and lite-protocol-tester.
In order to be able to highlight different patterns I checked with:
- Large message push
- Small message push
- Without relay enabled
- Without relay node installed in the network.
- Non-simulated long run against status.staging network.
Stress testing with large payloads to be published (lightpush).
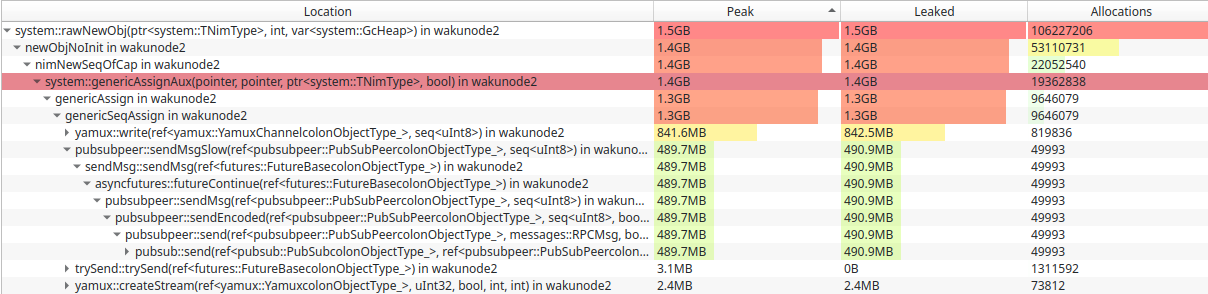
The above shows that major memory consumption happens during the broadcast phase, and this is due to the mostly slow path used for sending.
This needs some further clarification, because as will be seen below, only-relay case has no such issue.
Stress test with small payload messages to be published.
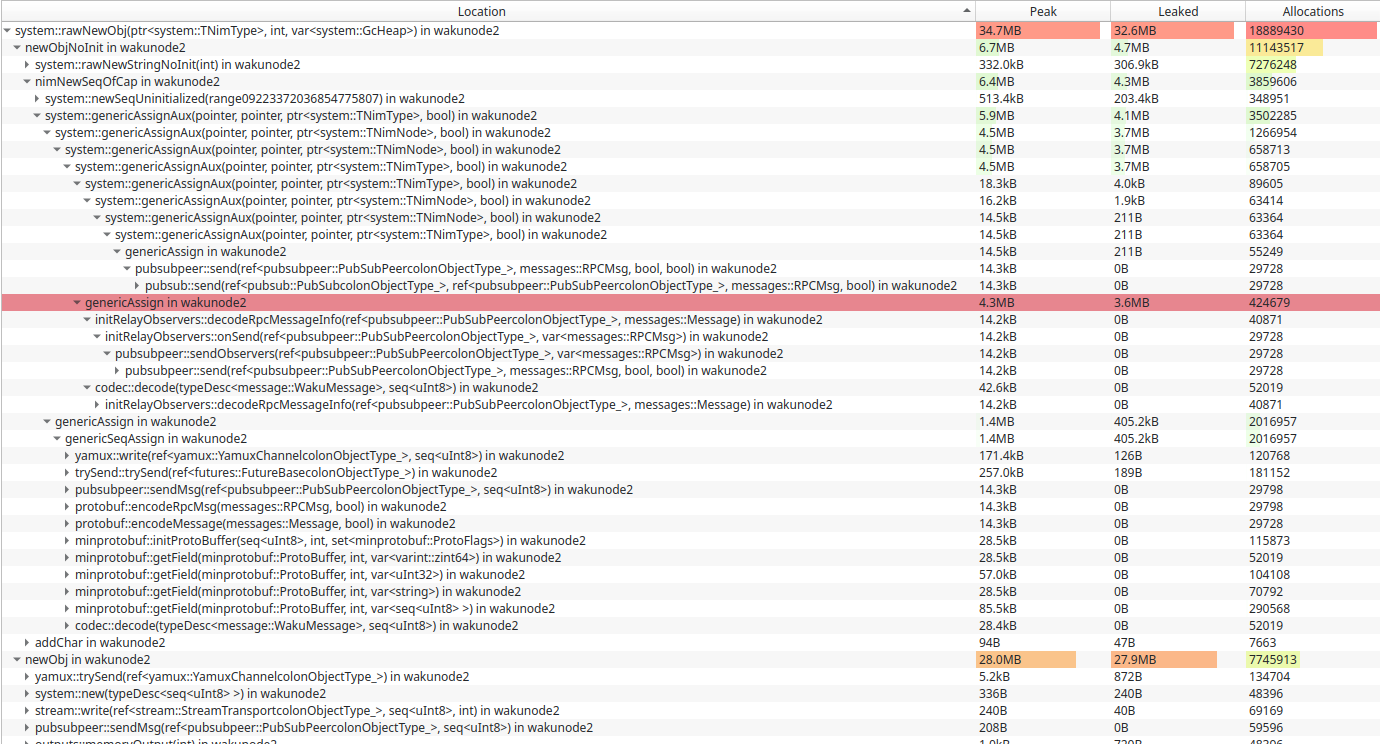
This scenario has different pattern and can avoid slow path.
The obvious difference is how larger payloads are handled.
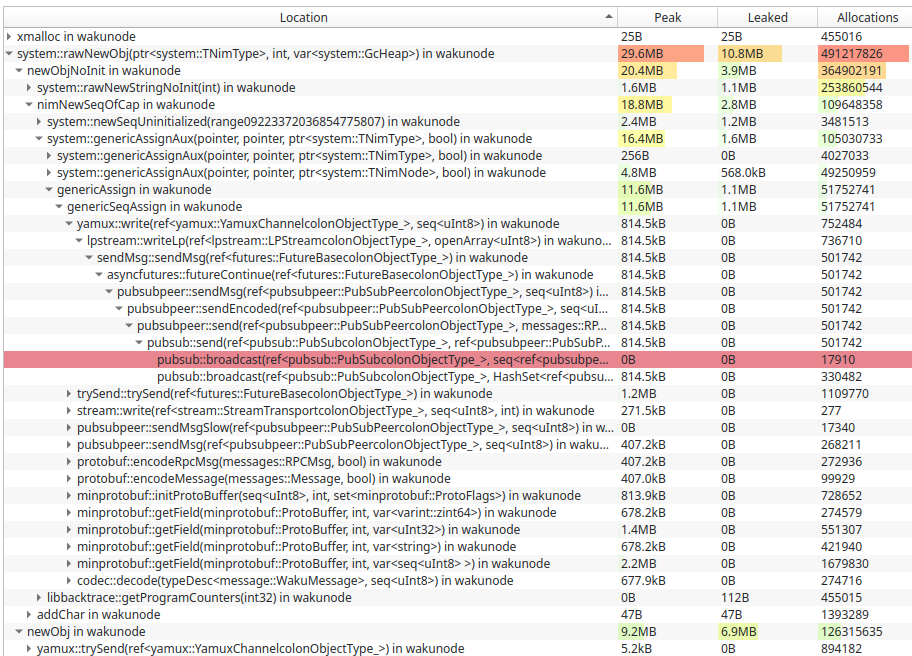
22h long status.staging node - mostly relaying only.
In this setup store was switched off (as caused index errors - maybe due to heaptrack influence) but lightpush and filter services were on, although it seems no client tried to use these services on the measured node.
Further actions
First of all we need to define the desired performance metrics to be achieved.
In the current software life-cycle we are not there where current performance causes any scalability issues!
Tweaking Nim GC
Unfortunately unlike documentation mentions imagined GC - strategies not yet implemented at current state.
We hope that sometime we can move or ARC/ORC model that may offer better characteristics for application like Waku.
Certainly we can debug and fix some part of the algorithm specific to pre-allocation and clean-up in order to prevent crash whenever it is possible.
Refactoring proposals
This is somehow inevitable that we need (already started discussing around) architecture review, in order to allow easier integration of new features and share data between protocols.
- May need a rework of WakuMessage as payload contributes highly in memory consumptions. My assumption is that in an async context using WakuMessage as a ref object, would lower the copies of single messages and would improve performance right away.
Heaptrack analysis did not confirm this assumption. Major contribution to memory allocations and payload copies are not because of WakuMessage! - Libp2p gossipsug/peersub mechanism can be optimised to use less message payload copies - maybe wort to consider introduce message abstraction that would allow add centralise in-memory storage of handled messages - regardless of their size.
- Libp2p observers needs to be controlled whether they need to / allowed to modify message - as nwaku never changes messages this way, it would be beneficial and possible to avoid copies.